


Introduction >> Analysed Maps
Analysed Maps
Measurements of pollutant concentrations are considered within the simulation chain, and allow to subsequently draw up so-called analysed maps on a daily basis, which, in turn, are based on concentrations simulated by the available models and data. These maps are generated twice a day, in the early and late afternoon, once enough observations have been made to provide representative information.
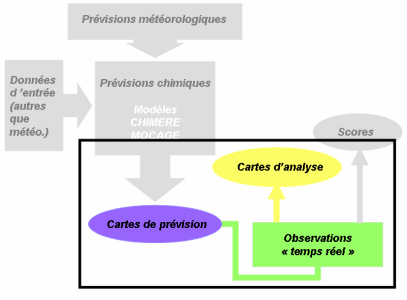
The mathematical method used to carry out the analyses is a geostatistical process that allows to adjust the raw simulations produced by the modelling process in order to reduce the difference between calculations and measurements taken at the observation points. The adjustment depends directly on the errors made by the model at the points where pollutant measurements are available.
Only areas where observations have been conducted are analysed, since the adjustments are considered to be unreliable where only few measurements are available.
WARNING!!! The analysed maps take into account observation data provided in real time, which are not subject to a complete checking procedure. Since these data may be adjusted later, the maps may change accordingly. Moreover, the number of observations available everyday is variable and may turn out to be insufficient to satisfactorily adjust the concentrations simulated by the model
in PREV'AIRAir Quality forecasts in
the PREV'AIR SystemAnalysed MapsVerification Available observation dataInput Data to the PREV'AIR SystemRequest for the Provision of Air
Quality Numerical Simulation DataLe programme CarpateDétail de la PrévisionChronogramme Nitrogen dioxide Forecast Ozone ForecastAOT MODEL - AOT SATELLITES PM 2.5 Forecast PM 10 ForecastForecast Desert dust Analysed Ozone mapsAnalysed PM 10 maps Ozone Observation Nitrogen dioxide Observation PM 2.5 Observation PM 10 ObservationVerification of the Ozone forecastsVerification of the Nitrogen dioxide
forecastsVerification of the PM 10 forecastsBilan Annuel : GénéralitésDépassement de seuils en heuresDépassement de seuils en jourAOTsMoyenne des picsStatistiques O3Statistiques no2Examples of photochemical
pollution episodesExamples of particulate
pollution episodesAvertissementLiencontactThe partners in PREV'AIR